Python Data Science Notebooks
Description
For statistics class, I used various online datasets and cleaned and analyzed them using NumPy/Pandas. I used Pandas to analyze things like confidence intervals and probability, and then afterwards visualized the data findings using Matplotlib.
Examples
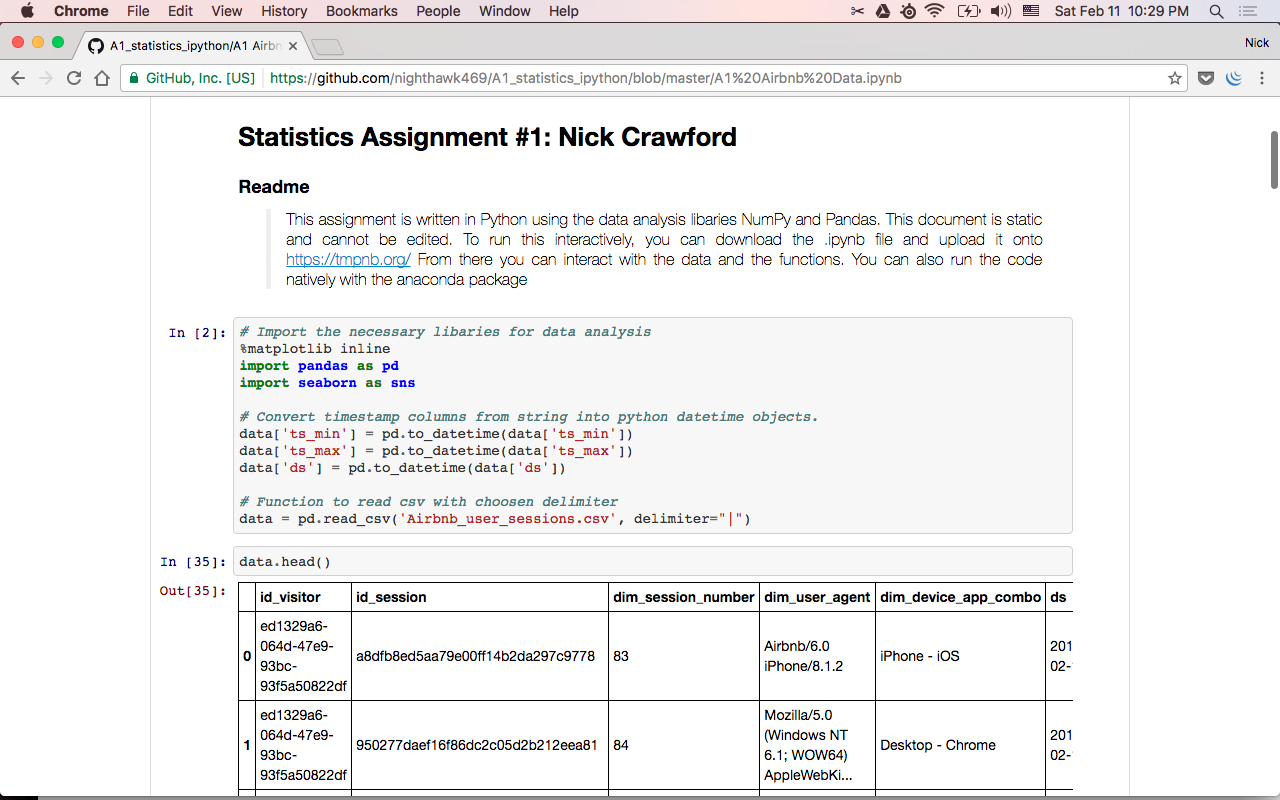
Pandas Notebook 1 - Airbnb Data
- Used the data in order to see what percentage of user sessions result in an airbnb booking
- Found what day of the week users are most active
- Determined the distribution of devices users use to access the site
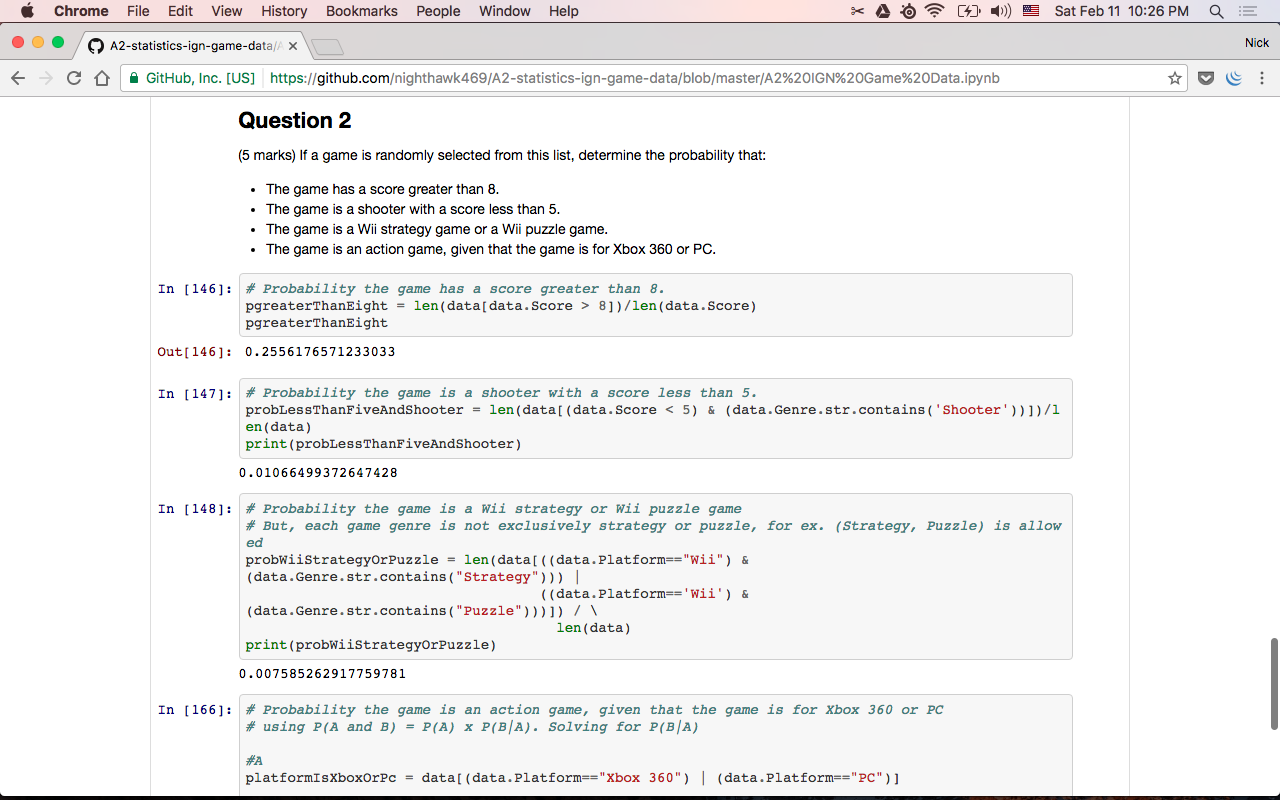
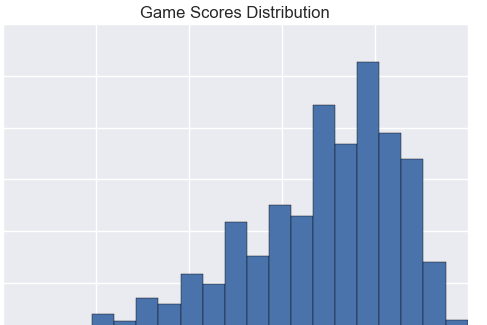
Pandas Notebook 2 - IGN Game Scores
- Used a histogram to show the frequency distribution of IGN game scores
- Determined the most popular genres and platforms
- Found probability of any game having score over 8/10
Pandas Notebook 3 - iPhone vs Android Speedtest
- Created graphical distribution of iOS and Android manufacturers
- Calculated averages of different countries internet speeds
- Calculated confidence intervals for download speeds